
Public Funding for the Arts 2025
Mohja Rhoads & Nakyung Rhee, National Assembly of State Arts Agencies (NASAA)
Introduction
Federal, state, and local governments collectively sustain public arts funding infrastructure in the United States. Congressional allocations support the National Endowment for the Arts (NEA), while State Arts Agencies (SAAs) receive both state legislative appropriations and federal contributions. Local Arts Agencies (LAAs) budgets are comprised, in part, by funding from all three government levels. This layered system ensures comprehensive grantmaking and services to arts and cultural organizations and artists nationwide. This article examines FY2025-2026 funding levels across all three government levels and analyzes how grantmaking patterns evolved from FY2019 to FY2024.
2025, A Year of Recalibration
In fiscal year 2025, public arts funding reflected a recalibration from historic pandemic-era peaks while remaining elevated relative to pre-pandemic norms. Across federal, state, and local levels combined, current estimates place FY2025 arts funding at $1.68 billion, representing a per capita investment of $4.99.
FY2025 highlights by level of government:
Federal: The NEA received a $207 million appropriation, flat from FY2024
State: SAAs received $687 million in legislative appropriations, an 8.5% decrease from FY2024.
Local: Local government arts expenditure was estimated at $787.8 million, reflecting an estimated 8.5% decrease from FY2024.
2025 shifts reflect continued fiscal moderation across all levels of government as extraordinary allocations due to one-time relief resources have largely phased out and governments are operating in more constrained environments. Even with declines from the highest recent years, FY2025 levels remain above pre-2020 baselines in nominal terms, underscoring that the post-pandemic period has reshaped the scale and purpose of public arts investment in an upward trajectory.
What Recalibration Meant in Practice
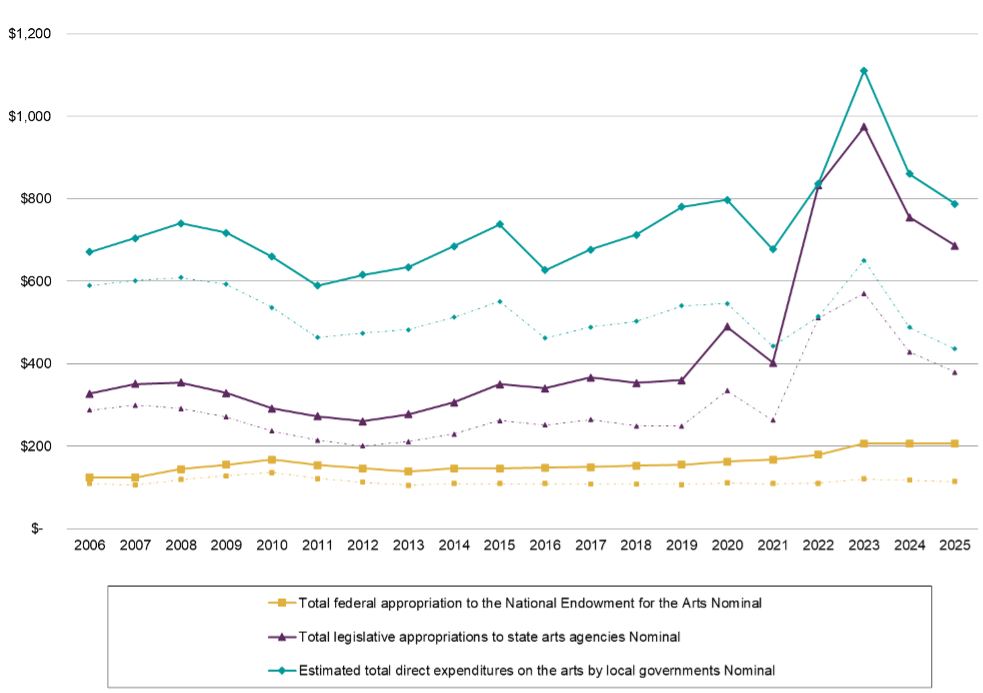
FIGURE 1. Federal, State, and Local Government Arts Funding, Nominal and Inflation-Adjusted Dollars, 2005–2025
The NEA FY2025 appropriation remained the same as FY2024 at $207 million. The fiscal year began under continuing resolutions (CRs) —temporary funding measures that extend previous year’s spending levels when Congress has not enacted full appropriations. A CR was enacted on March 15, 2025, maintaining FY2024 funding levels through federal FY2025, which ended on September 30, 2025.
For FY 2025, state appropriations declined by 8.5% from FY2024 levels. This slight decline continued the transition away from peak recovery-era budgets and is consistent with a broader shift from extraordinary pandemic-era fiscal conditions toward typical budget cycles.
Local support continued to anchor community access. Local government investment remains essential to cultural ecosystems through place-based programming, facilities and services. Local estimates suggest continued decline from FY2024.[1]
Per Capita Snapshot
FY2025 total public arts investment of $5.00 per person included:
$0.61 federal
$2.04 state
$2.34 local
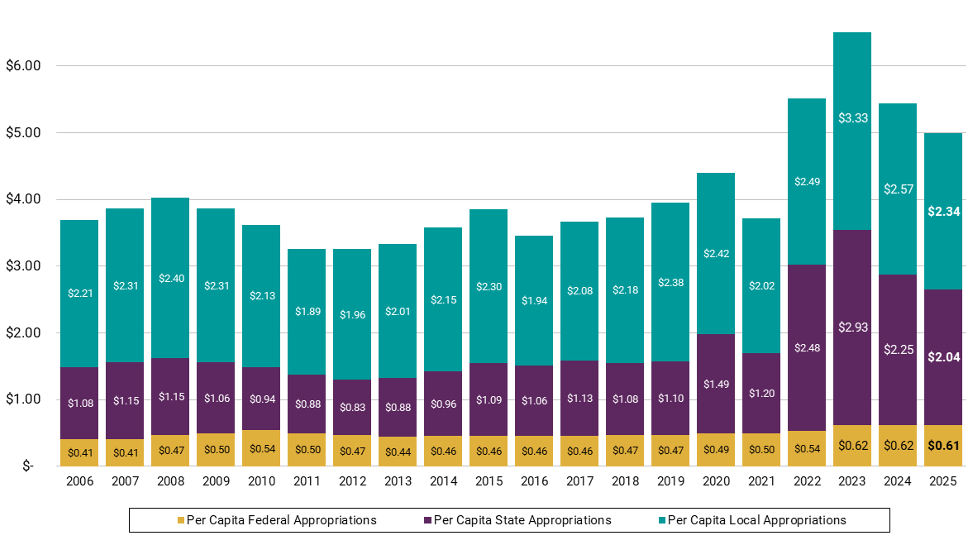
FIGURE 2. Federal, State, and Local Government Per Capita Appropriations, 2005–2025
Compared with FY2024 per capita, this represents a decrease of $0.45 per person (about 8%).
Per capita investment offers a useful lens for understanding public arts funding in relation to population size and civic capacity. Per capita measures help illuminate the fact that public arts funding is a modest share of overall government spending. For perspective, federal outlays in FY2025 equated to roughly $433 per person for transportation and $211 per person for education, training, employment, and social services[2], underscoring how comparatively small per-capita arts funding is even when it delivers outsized civic value. While modest in comparison to other outlays, public arts funding can have an outsized influence by leveraging funding across the private and public arts sectors and stabilizing cultural delivery systems.
Looking Ahead to FY2026
At the time of this writing, the FY2026 appropriations process remains under development, with federal agencies operating under temporary funding measures while Congress works to finalize full-year appropriations. The federal appropriations process for FY2026 has included different funding proposals. The federal executive administration’s budget request proposed eliminating NEA funding, while the House and Senate have advanced different funding levels, with the House proposing $135 million and the Senate proposing to maintain funding at $207 million. As of early January 2026, the House passed a combined package of three appropriations bills (often called a minibus) that provides $207 million for the NEA. Final funding levels will be determined through the legislative process.
State funding projections currently suggest continued moderation for FY2026. Funding projections for appropriations, including line items, will see around a 6% decline, while appropriations excluding line items will see around a 2.5% increase.
Over the last two decades, public arts funding has responded to economic conditions, policy choices, and major disruptions. The pandemic years saw significant expansions in funding, followed by moderation in FY2024-2026 as one-time relief allocations tapered. The following sections examine how this evolution has transformed grantmaking patterns from FY2019 through FY2024, the most recent year with complete grantmaking data.
Public Arts Funding as a Multilevel Cultural Infrastructure
Public arts funding in the United States has entered a new structural phase. Across federal, state, and local levels, investments made during the pandemic have not receded to pre-2020 norms but have instead stabilized at a higher baseline. This evolution positions public arts funding as essential civic capacity—supporting organizations, artists, educators, and communities as integral to economic vitality, social cohesion, and place-based development.
Across all levels, common trends are evident: elevated funding levels, increased median award sizes, sustained geographic reach, and continued prioritization of rural and underserved communities. While specific allocations fluctuate year to year, the overall system shows continuity rather than retrenchment. Taken together, these findings underscore the role of public arts funding as national cultural infrastructure—leveraging federal scale, state coordination, and local implementation to ensure access, resilience, and long-term public value.
National Endowment of Arts (NEA) Trends in Grantmaking, 2020–2025
From FY 2020 through FY 2025, NEA appropriations[3] increased from $162.5 million to $207 million, representing meaningful nominal growth while remaining approximately 0.003 percent of the federal budget. Funding levels rose sharply during the pandemic and then settled into a structurally higher post-pandemic baseline rather than reverting to pre-2020 norms. Throughout this period, the NEA maintained a consistent grantmaking model, distributing roughly 80% of its budget through grants and awards and directing 40% of grant dollars to states and jurisdictions via state and regional arts agencies. The result is an effective federal–state partnership that emphasizes reach, leverage, and local implementation rather than centralized delivery.
Grantmaking volume remained similarly stable. After a modest decline in the average number of grants during the height of the pandemic, annual awards rebounded to approximately 2,400 grants per year by FY 2024–2025. This stability suggests that increased appropriations have primarily supported recovery, cost pressures, and organizational capacity rather than a fundamental expansion or contraction of the NEA’s national footprint.
Supporting underserved communities has remained a feature of NEA grantmaking, though reported shares fluctuate over time. Across the period, a substantial portion of grants consistently reached high-poverty neighborhoods, underserved populations, and small and mid-sized organizations. While the percentage of grants explicitly reported as occurring in high-poverty areas declined modestly after FY 2021, this shift likely reflects changes in context, reporting, and recovery patterns rather than a retreat.
State Arts Agency (SAA) Trends in Grantmaking, 2019 - 2024
State Arts Agency[4] grantmaking in 2025 reflects a durable shift in the scale, purpose, and impact of public funding for the arts. Building on changes catalyzed during the pandemic, public investments have moved beyond short-term relief toward long-term cultural infrastructure—supporting organizations, artists, educators, and communities as essential components of civic life. Rather than returning to pre-2020 norms, grantmaking levels, award size,s and geographic reach remain structurally elevated, underscoring the unique capacity of public funding to translate crisis response into sustained systems-level support.
Across grant categories, state arts agencies increasingly balance breadth and depth: maintaining broad geographic access while providing more stabilizing, flexible funding. This evolution positions public arts funding as distinct from private and philanthropic sources, which are often project-restricted, geographically concentrated, or tied to donor priorities. Public funding, by contrast, is accountable to communities statewide and designed to address gaps in access, capacity, and equity.
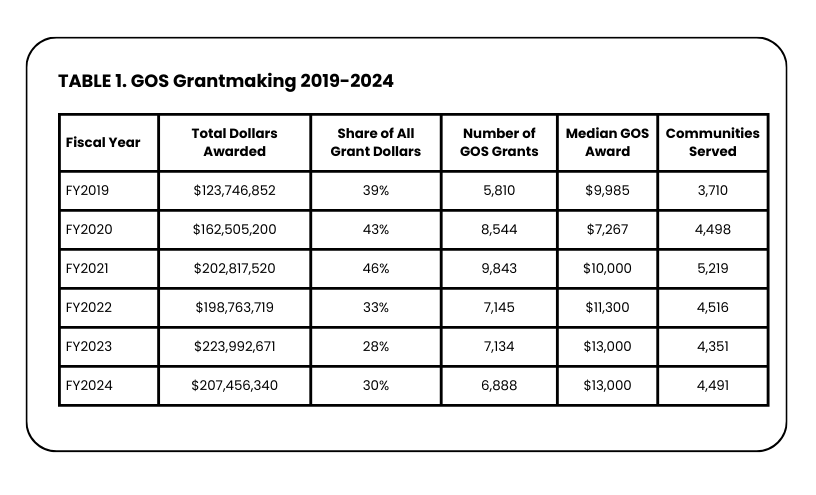
TABLE 1. GOS Grantmaking 2019-2024
General Operating Support: Sustaining Cultural Organizations
General Operating Support (GOS) remains a cornerstone of state arts agency grantmaking. Since the pandemic, total GOS funding has risen substantially and settled at a higher long-term baseline, even as emergency relief funds have tapered. In 2024, GOS continues to account for roughly one-third of all grant dollars, reflecting its role as core infrastructure funding rather than episodic assistance.
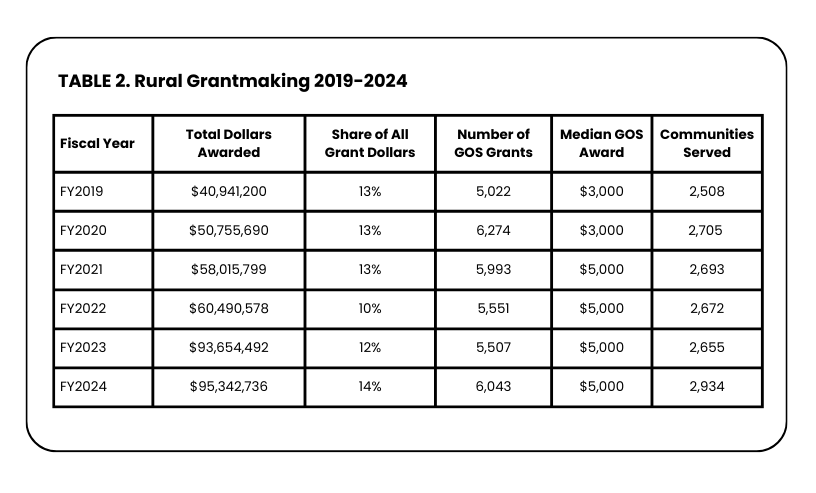
TABLE 2. Rural Grantmaking 2019-2024
At the same time, the composition of GOS funding has shifted toward fewer but larger awards. Median grant sizes are significantly higher than pre-pandemic levels, signaling deeper investment in organizational stability and capacity. These trends reinforce the role of state arts agencies as providers of unrestricted funding—support that is often unavailable through federal, philanthropic or private sources, particularly for small and mid-sized organizations.
GOS funding continues to prioritize smaller organizations and rural communities, ensuring that increased investment does not come at the expense of access. While funding for larger organizations has grown, the majority of GOS awards still support organizations with budgets under $1 million, many of which operate in communities with limited alternative funding options.
Geographic Reach and Arts Access for Rural Communities
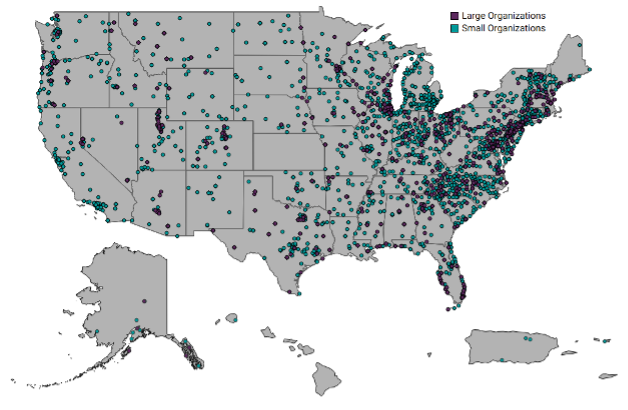
FIGURE 3. Geographical Distribution of GOS Grants by Large and Small Organizations, 2024
Note: Kansas GOS data will be available starting FY2025-2026.
Public arts funding plays a critical role in reaching rural communities. In 2024, state arts agency grantmaking to rural areas remains well above pre-pandemic levels, reflecting a sustained commitment rather than a temporary expansion. While the rural share of total grant dollars has remained relatively stable, total funding and median award sizes have increased, enabling deeper and more durable support.
These patterns highlight the distinct function of public funding in addressing geographic disparities. Private and philanthropic arts funding is often concentrated in urban centers, whereas state arts agencies ensure statewide reach, supporting cultural participation and infrastructure in communities that might otherwise be left behind.
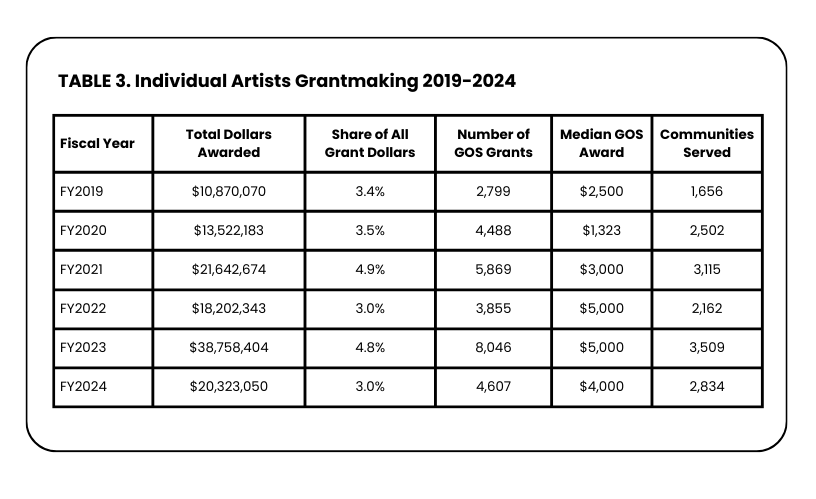
TABLE 3. Individual Artists Grantmaking 2019-2024
Individual Artists: Broad Access with Modest Awards
Grantmaking to individual artists continues to emphasize access and geographic reach over income replacement. While total funding for artists increased significantly during the pandemic and remains above pre-2020 levels, individual artist grants still represent a relatively small share of total grant dollars despite accounting for a large number of awards.
This approach reflects a long-standing public funding strategy: supporting many artists across many communities with modest awards that recognize artistic contribution, encourage continued practice and maintain cultural vitality. Even as funding levels fluctuate year to year, the number of communities served by individual artist grants continues to grow, reinforcing place-based equity as a core policy objective.
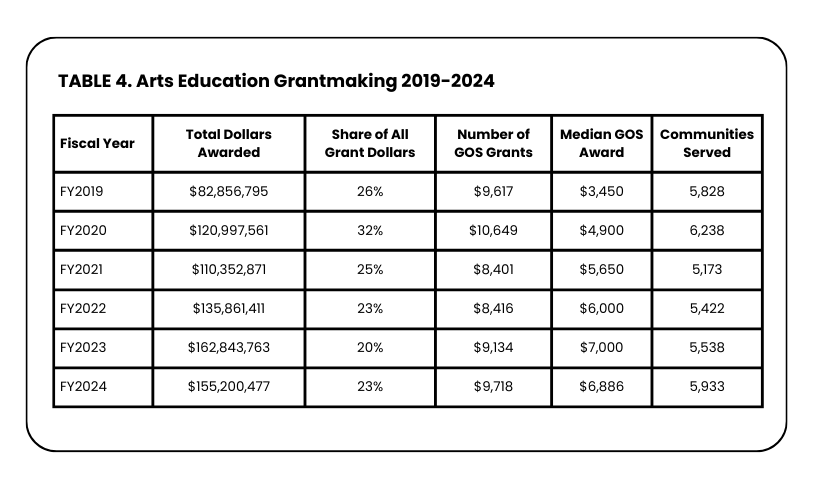
TABLE 4: Arts Education Grantmaking 2019-2024
Arts Education: From Projects to Infrastructure
State arts agency investment in arts education has nearly doubled since pre-pandemic years and remains at a new, higher baseline in 2024. Although arts education now represents a smaller share of total grant dollars—due to growth across other funding categories—absolute investment levels are significantly higher.
Grantmaking patterns increasingly favor fewer, larger awards, with median grant sizes more than doubling over time. This shift signals a move away from short-term, project-based funding toward more stable investments that sustain educational infrastructure, workforce capacity and long-term access for students statewide.
Local Arts Agencies: Decentralized Cultural Delivery
Local arts agencies (LAAs) continue to function as essential intermediaries in the public arts funding system. State arts agency support for LAAs remains well above pre-pandemic levels, reinforcing their role as decentralized service providers that tailor arts programming to local needs.
While funding surged during the height of federal relief efforts, post-pandemic investments have stabilized at higher levels, with median awards supporting operating costs, regranting, and community-based programs. Through LAAs, public funding extends the reach of state and federal investments into communities that lack the capacity or scale to access funding directly.
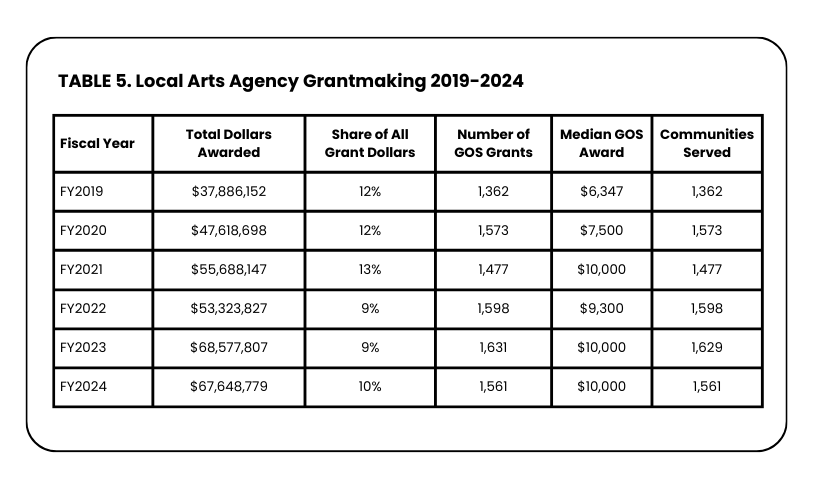
TABLE 5: Local Arts Agency Grantmaking 2019-2024
Grantmaking to Local Arts Agencies
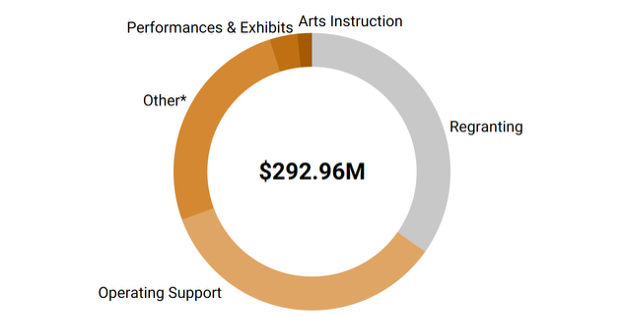
FIGURE 4. SAA Support for LAA Activities, FY2019-FY2024
*Other activities include arts education programs, marketing assistance, professional development, and others.
From FY2019 to FY2024, state arts agency funding to local arts agencies (LAAs) increased substantially, rising from about $36.7 million to nearly $67.8 million. The most dramatic growth occurred during the pandemic, when CARES Act and American Rescue Plan funds drove a sharp increase in total dollars and median award sizes. Although funding levels moderated after the FY2021 peak, post-pandemic investment has remained well above pre-2020 levels, indicating a durable shift rather than a temporary relief-driven surge
Across the period, LAAs remained a stable and targeted part of state arts agency grantmaking. They consistently represented about 5–6% of all grants by number, while their share of total grant dollars fluctuated more widely—peaking during the pandemic and then rebalancing in subsequent years. Median grant sizes stabilized at roughly $10,000 after 2022, and the number of communities served expanded compared with FY2019, underscoring LAAs’ continuing role as local cultural infrastructure even as overall funding strategies evolved.
From FY2019 through FY2024, state arts agency funding enabled local arts agencies (LAAs) to support a consistent and diverse mix of community-based arts activities, including operating support, arts education, festivals and events, community arts development, and regranting to local organizations and artists. Across all years, LAAs functioned as decentralized service providers and intermediaries, channeling resources to meet local needs and expand arts access. During the pandemic period, operating support became more prominent—most notably in FY2021—reflecting stabilization priorities, but core programmatic activities such as education, community engagement, and regranting remained central throughout the period. LAA support shows continuity rather than disruption in the reach of activities even as funding levels increased and geographic reach expanded.
NOTES
[1] Local arts agencies' (LAAs) FY2024-2025 funding is not comprehensively reported at the time of publication. To provide the FY2024 and 2025 LAA figures, NASAA estimated the FY2024 LAA total by applying the same year-over-year percentage decline observed in state legislative appropriations to the most recently reported LAA total for FY2023 ($1.11 billion). This approach assumes local arts funding followed a comparable downward trend during the FY2023–FY2024 transition as pandemic-era relief funding phased out and budgets tightened.
[2] Bureau of the Fiscal Service, Outlays by Function, FY2025, retrieved from https://www.fiscal.treasury.gov/files/reports-statements/combined-statement/cs2025/outlay.pdf. Per-capita figures were calculated by dividing FY2025 outlays by the FY2025 U.S. population estimate from the U.S. Census Bureau’s Population Estimates Program.
[3] NEA data summarized from NEA Quick Facts 2020-2025. 2025 NEA Quick Facts.
[4] Data for this time period come from the National Assembly of State Arts factsheets for 2019 to 2024: https://nasaa-arts.org/research/grant-making-3/
ABOUT THE AUTHORS
Mohja Rhoads is Research Director at National Assembly of State Arts Agencies (NASAA).
Nakyung Rhee is Research Manager at National Assembly of State Arts Agencies (NASAA).