
Paths to Equity
Silicon Valley: Cultural Backwater or Harbinger?
Tom Borrup, Ph.D., Heidi Wagner, Elizabeth Taing, and Amanda Rawson
Honoring People and Place
The authors wish to acknowledge and honor the Thámien Ohlone and other Indigenous peoples who have continuously inhabited the area now known as Silicon Valley for at least 10,000 years. Their unceded lands and lifeways were colonized by Spanish missionaries beginning in 1769. These lands continue to be of great significance to the present-day Muwekma Ohlone Tribe of the San Francisco Bay Area. Over three million people from all over the world now reside in Silicon Valley.
Introduction
How does a city-region and its cultural sector assess progress towards equity? Could letting go of large cultural institutions that represent White or Euro-centric cultures be a hallmark of success for American cities that desire movement towards racial and cultural equity? Are hundreds of new, grassroots organizations starting up – organizations largely tied to communities of color and immigrants – an indicator of success? What measures might be fitting as cities and the cultural sector at large in the United States claim to prioritize racial equity and turn their attention to undoing systemic racism? While not central to what we set out to examine in a recent study of the nonprofit arts and cultural sector in Silicon Valley and its “Capital City” of San José, these questions revealed themselves.
Across the United States, large, well-funded institutions housed in iconic edifices stroked the egos of city promoters and business tycoons through the industrial era. They have been linked by some researchers as key to economic growth and global distinction. However, do such “anchor” institutions actually help White supremacy hold its position in changing tides – as anchors are designed to do?
As a follow-up to our 2009 study described in this publication in 2010 (Something Different is Stirring: DIY Culture in Silicon Valley), the 2020 study described here provides an in-depth picture into changes in the nonprofit cultural sector in a region that is as diverse, dynamic, well-educated, and wealthy as any in the world.
Both 2009 and 2020 studies examined arts and cultural organizations in Silicon Valley as expressed by the numbers, types, expenditures, and geographic distribution of nonprofit organizations along with municipal investments in arts and culture. Both studies also compared San José with the same nine peer cities across the U.S. to gain perspective on how the landscape is organized and has evolved in contrast to these peers. Those cities were selected in 2008 based on characteristics related to population, economy, and active cultural sectors. Data for this study were collected prior to the impacts of COVID-19. Uniform U.S. government data was collected for nonprofit arts and cultural organizations for all the cities. Silicon Valley organizations were further examined through California State data and web searches for all organizations.
Questions of Equity Emerge
Recent global research stresses dynamic relationships between vibrant arts and cultural scenes and thriving economies; but thriving for who? The persistent fly in the ointment of this body of generally pro-arts research is the growing economic and racial inequities in the very cities with burgeoning cultural sectors. Creative class champion Richard Florida in his 2017 mea culpa book, The New Urban Crisis, drew clear connections between the most economically successful creative cities and growing economic inequalities.
Between 2009 and 2020 the City of San José saw four of its seven largest cultural institutions (budgets over $5 million) dissolve or shrink dramatically – institutions that focused on White or Western European cultural forms. This came after the prolonged struggle of the city’s 123-year-old symphony orchestra that folded in 2002. During this same time in nearby San Francisco, 16 organizations joined the ranks of those with annual expenditures over $5 million, doubling the number of large organizations there in a decade. Inequities related to income, housing costs, etc., continued to grow in both cities so there is no simple correlation to draw here. However, the population in San Francisco grew Whiter during this time while it grew more diverse in San José and Silicon Valley as a whole.
As far as the cultural sector goes, there is no formal, agreed-upon yardstick to measure its health. Most assessments seem to begin with institutions, generally exemplified by strong balance sheets and the numbers of people annually going through their doors or sitting in their seats. And while more institutions have begun to look at the racial and ethnic makeup of their audiences, artists, staffs, and boards, does changing the colors of the faces in the seats, on the stages, or at the desks represent cultural equity?
Next on the list of measures of a healthy sector might be existence of a robust “middle class” of medium-sized nonprofits and how well they play together, and support artists and cultural production. Another measure of an active cultural community may be its rate of nonprofit start-ups. The latter is often considered undesirable by many funders of the arts who see newcomers exacerbating distribution of limited resources.
Our study found the arts and cultural landscape of Silicon Valley, and its capital city of San José, displayed significant differences from similar-sized American cities and metropolitan areas. While this region certainly has more than its share of economic inequities, there may be clues here relative to cultural equity. In the decade between the two studies the formal dimensions of Silicon Valley’s cultural landscape evolved in material and symbolic ways coming into closer alignment with the region’s changing demographics. Its nonprofit and municipal actors exhibited responsiveness to evolving populations, cultural interests, and regional identities. Silicon Valley’s nonprofit arts and cultural sector demonstrated high value placed on varied expressions of culture and in making the Valley’s increasingly diverse population feel at home.
Our findings resonate with two earlier Silicon Valley studies that documented participatory and informal arts and cultural activities. Dr. Pia Moriarty, in 2004, found widespread participatory cultural practices among immigrant communities in both informal and formal settings.[i] In 2005, Dr. Maribel Alvarez examined and documented robust cultural practices outside formal settings in communities across Silicon Valley.[ii]
As Moriarty and Alvarez found, the cultural landscape of this region is composed of more than the activities of formally organized nonprofits. They documented considerable activity taking place through for-profit and unincorporated enterprises, informal settings among families, neighborhoods, and social interest groups as well as through public sector and educational entities and nonprofits not categorized as arts and culture in standard data sources. The same is likely true in other cities with diverse population and large groups of immigrants. Nonetheless, we assert the nonprofit sector serves as a key indicator of the region’s overall cultural landscape. Further, standardized nonprofit data sources make possible comparisons with other cities so as to provide a relative picture of this indicator.
A Different Cultural Landscape
A city of over one million people, San José centers a region of more than three million – one of the most prosperous and well-educated populations anywhere. San José displays a mix of cultural organizations unlike those found in any of the nine peer cities. In contrast, San José is not home to a cohort of large Euro-centric cultural institutions – in spite of concerted past efforts to build them. One reason may be that this city had a majority White population only briefly during its history. It also may be partly in deference to its proximity to San Francisco. However, in multiple other American city pairs – where travel distance and time are similar – each city maintains its own such institutions. Patterns in San José and Silicon Valley suggest an adaptability and permeability related to cultural organizations that enables newcomers to make their cultural voices heard and make this place feel like home.
In the 2020 study we found three distinctive characteristics of the nonprofit arts and cultural landscape in Silicon Valley and city of San José detailed further below.
Expression of Regional Identity. An increasing number of newly formed nonprofits during the past two decades were categorized as culturally specific. Of those, less than 20% were identified as addressing Western European cultures. Meanwhile, some older, Euro-centric organizations disbanded, shrank, or became inactive. The result is an overall profile more in tune with the region’s diverse demographics and identity in regards to both numbers of organizations and their collective expenditures.
Active Start-up Environment of Entrepreneurial Organizations. The region demonstrated robust start-up activity among arts and culture nonprofits. Essentially half or 49% of the 1,063 nonprofit cultural organizations found to be active in 2019 were 10 years old or less. In the 2009 study we similarly found a pattern of entrepreneurship for which the region is widely known very much alive in the nonprofit sector.
Supportive Municipal Platforms. Municipal spending for arts and culture in the cities and towns of Santa Clara County, representing two-thirds of Silicon Valley’s population, played an important role in supporting the cultural landscape. Public sector support in arts and culture in the County grew between 2008 and 2019 at a faster rate than inflation, population growth, and national averages for municipal support of the arts. The largest expenditures were for public facilities used by the changing and growing cast of cultural producers and presenters.

Figure 1: Percentage of groups formed during five-year periods identified as culturally specific organizations.
The cultural landscape of Silicon Valley and San José exhibited characteristics distinct from other regions and cities in the U.S. It may be considered what Silicon Valley African Film Festival Director, Chike Nwoffiah, called, “a valley of many voices”. In short, Silicon Valley generated an unusual, permeable, diverse, and responsive cultural landscape more in tune with its population and regional identity. Its cultural vitality depends less on large institutions built on business models of centralized production and distribution from the industrial era and more on small and medium-sized, entrepreneurial organizations and informal activities.
Our 2009 report concluded:
No place in the world is better known for technological innovation. No place can boast a more open and robust environment for new ideas and entrepreneurs. No place has the kind of widely-vested diversity where new arrivals so readily connect, organize, invest, and contribute to a vibrant economy and culture. No urban region is so consistently diverse in population. There is no place like Silicon Valley. In the midst of this world-famous high-tech capital a cultural infrastructure has emerged that enables the start-up of new cultural enterprises and fosters participant-generated self-expression by an unprecedented range of people. This environment evolved simultaneous to the emergence of a global workforce, creative economy, and diverse population. Silicon Valley‘s illustrious business environment and global impact have sparked many analysts to re-think corporate structures and global economics in the post-industrial age.[iii]
Patterns observed eleven years later continued in evidence.
These studies were commissioned by Silicon Valley Creates and its predecessor known as 1st ACT Silicon Valley. Primary authors of the 2020 report were Tom Borrup, Heidi Wagner, Amanda Rawson, and Elizabeth Taing. The 2009 study was authored by Tom Borrup, Heidi Wagner, Paul Anderton, and Erik Takeshita.
Study Details: Expressions of Regional Identity
Based on their stated purposes and/or missions, we identified Silicon Valley nonprofits that indicated a culturally specific practice or orientation and that fit within cultural or ethnic practices relative to global regions using World Bank categories[iv] with the addition of LGBTQ communities that are generally included in definitions of diversity in the U.S. Specific art forms such as orchestral music, ballet or modern dance, and theatre were characterized as Western European unless based in or expressly serving a different cultural group. Of a total of 1,063 active organizations in 2019, 41%, or 431 organizations, were categorized as culturally specific. This compares to 274 identified in 2008.

Figure 2. Numbers of Silicon Valley organizations by cultural group and change from 2008 to 2019.[v]
We found the remainder, or 59% of the organizations, serving – or endeavoring to serve – the community as a whole, although arguments could be made that many of these serve a cultural “status quo”. These included arts councils and advocacy groups, arts education organizations, media and publishing organizations, as well as general and multi-purpose organizations focused on non-culturally specific music, dance, theatre, folk, and craft arts.
Between 2008 and 2019, we found 31 newly formed organizations whose missions and/or art forms were rooted in Western European cultures. During the same time, we found a total of 106 new organizations rooted in East Asian and Pacific, South Asian, and Asian cultures. Organizations identifying with Latin American and Caribbean, Middle Eastern and African, and other cultures grew only slightly in numbers.
Of organizations identified with a specific culturally based form or community, the percentage of the total identified with Western European cultures declined from 34% to 29% of the total between 2008 and 2019 (Figure 3). Meanwhile, South Asian and Asian groups grew by seven points as a percentage of the total. All other groups changed more or less by only 1%.

Figure 3. Percent of total organizations per cultural group comparing change 2008 to 2019.
Expenditures by culturally specific organizations demonstrated a more dramatic shift. As aggregated (Figure 4, top graph) using broader demographic categories, aggregated total expenditures of White organizations declined by one-half. Asian organizations nearly doubled their aggregated expenditures.
This decline of Western European organizations during the decade was largely because of the demise or downsizing of several larger organizations as noted earlier. This coincided with rapid growth in organizations rooted in Asian cultures and modest growth of Latinx organizations. As a result, there is a closer balance of cultural resources in conformance with population changes in Silicon Valley (Figure 4, bottom graph).

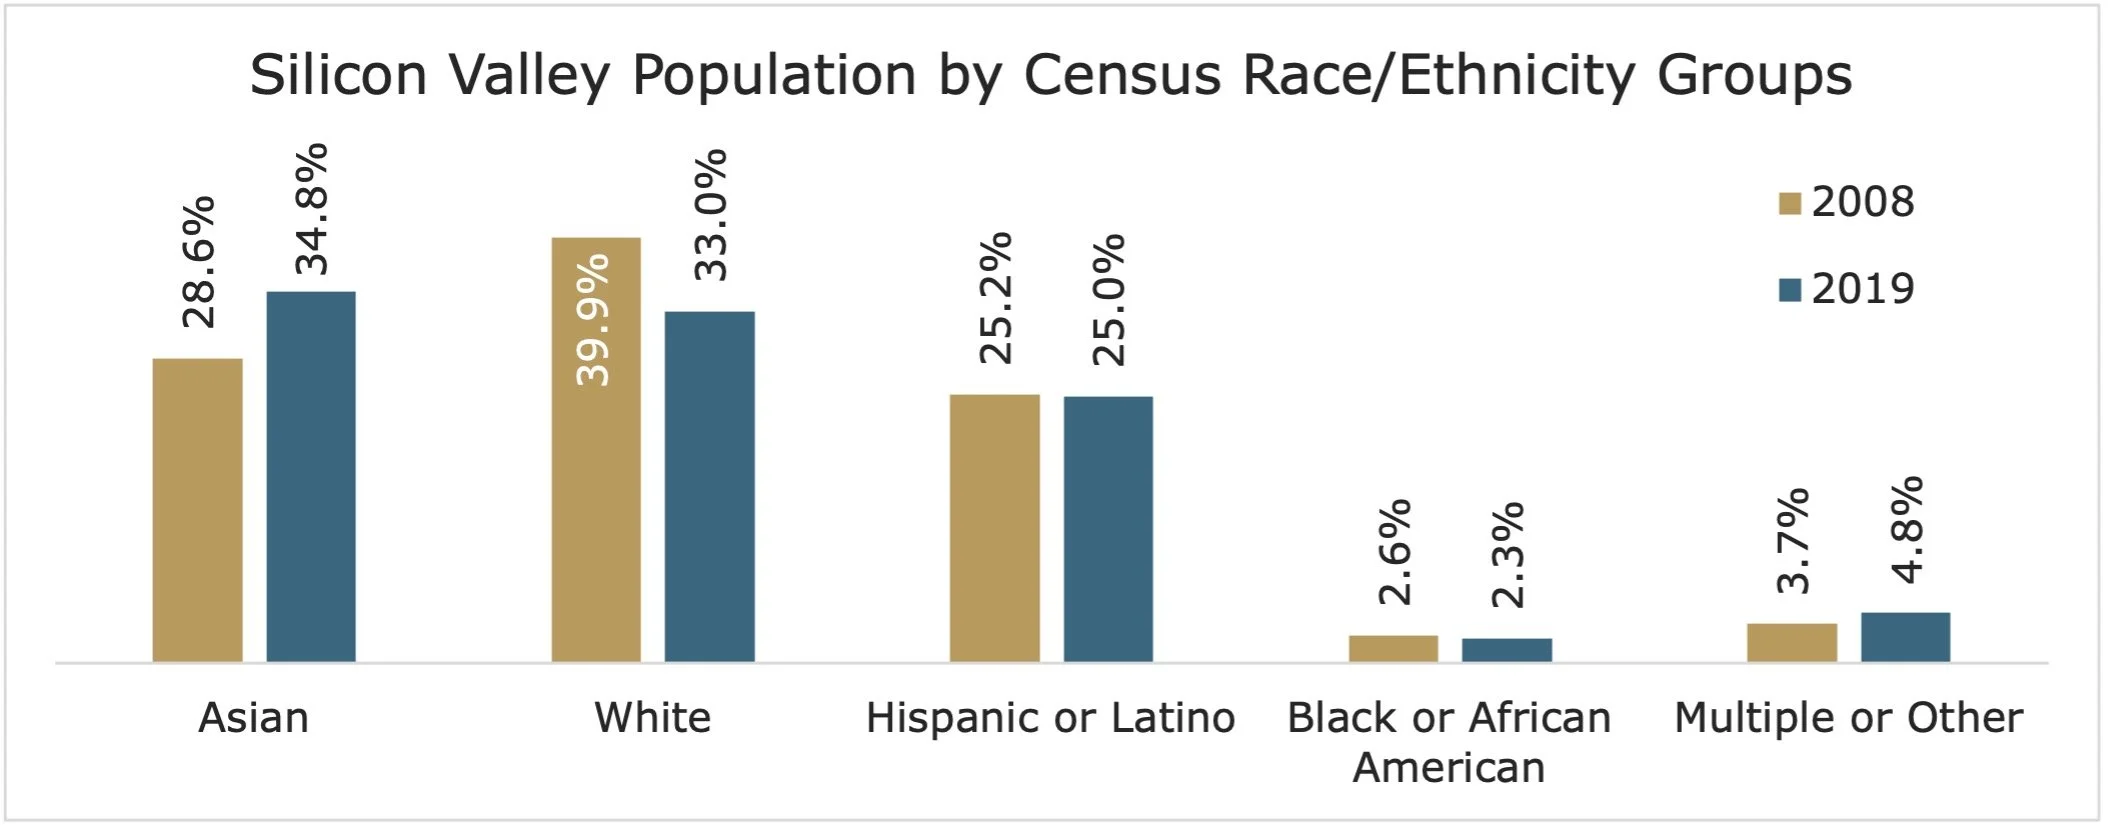
Figure 4. Silicon Valley expenses by race/ethnicity groups adjusted for inflation (top) and Silicon Valley population by race/ethnicity groups (bottom).
While data show that Latinx organizations grew modestly in numbers and expenditures, they continued to lag in relation to the size and longevity of this population in the region. While long underserved by philanthropic and public sector support, it is also likely that this lag is partly due to ways in which the region’s most long-established ethnic group celebrates and participates in culture. In other words, informal activities, festivals, churches, family groups, and other modes of participation in traditional and creative activities take place more outside the context of nonprofit organizations as Moriarty (2004) and Alvarez (2005) found. Newer immigrant communities, however, formed nonprofits at a higher rate presumably to provide formal structures around which to gather, replicate, and celebrate home cultures.
Active Start-up Environment
Since our 2009 study, Silicon Valley continued to demonstrate robust start-up activity and other entrepreneurial behaviors in the arts and culture sector. It must be noted that we did find other cities, most notably Austin, that exhibited robust start-up rates during this time. However, while Austin’s start-up rate was high, the beginning number was small. In the ten years leading up to 2008, 286 newly active organizations joined the sector in Silicon Valley. They represented 44% of the total of 653 organizations identified at that time. During the subsequent years leading to 2019, there were 519 newly active organizations out of a total of 1,063. Essentially half or 49% of the active nonprofits in 2019 were 10 years old or less (Figure 5).

Figure 5. Numbers of Silicon Valley organizations active in 2019 by year founded in five-year intervals.
Those 519 organizations founded since 2010 that remained active in 2019 reported total expenditures of $26.03 million. This represents an average expenditure of $50,100, a substantial sum for relatively young organizations.
In a comparable period between 2000 and 2009, 230 organizations formed and remained active. Data from 2019 showed their collective expenditures of $41.08 million, an average of $179,000. Between 1980 and 1989, a period of prolific public investment in the arts in San José, 65 organizations formed that remained active. They reported a total of $68.66 million in spending in 2019, or an average of $1,056,000 per organization. These include some of the largest organizations still active.
For purposes of this study, organizations with expenditures of $5 million or more were categorized as large. Those with expenditures between $50,000 and $5 million as medium, and those with $0 up to $50,000, as small. While the numbers of organizations grew in all expenditure categories in Silicon Valley (except those over $5 million), the percentages of the total declined at both the low end and the high end indicating the greatest level of growth and activity took place among medium-sized organizations. The numbers that reported $0 in fiscal activity grew from 352 to 526 but still declined as a percentage of the total. Those between $1.5 and $5 million and over $5 million also declined as a percentage of the total.
In contrast to all nine peer cities, San José was the only one that was home to fewer large cultural nonprofits (budgets over $5 million) in 2019 as well as those at the lowest end of the expenditure scale. San José had the smallest percentage of cultural organizations reporting $0 in expenditures in 2019, tied with Minneapolis (Figure 6).

Figure 6. Organizations reporting $0 in expenditures as a percentage of total organizations and relative percentages 2008 and 2019.
Within the city of San José, between 2008 and 2019, large organizations decreased from seven to three but the number remained constant at seven in Silicon Valley due to the growth of some organizations outside the city. In all other cities the numbers of large cultural organizations increased in numbers – in some cases dramatically. In Austin, they grew from one to eleven, in San Diego from six to twelve, and in San Francisco from sixteen to thirty-one. Minneapolis showed the most relative stability with eleven in 2008 and thirteen in 2019.
One assertion for the dearth of larger cultural organizations in San José is that San Francisco is relatively close with an abundance of such institutions. While this no doubt has impact on the make-up of San José and other Silicon Valley arts and cultural organizations and activities, the situation is not dissimilar to multiple other city pairings in the United States where travel distance and time are similar. Each maintains proportionately large Western European-focused museums and performing arts organizations as well as presenting venues.
Entrepreneurial Character
In keeping with its robust start-up environment, San José, as well as Silicon Valley arts and cultural organizations demonstrated a participatory and entrepreneurial character. Both San José, and Silicon Valley have a higher percentage of organizations in the $1 to $50,000 category – double or nearly double the rate of most of the other peer cities (Figure 7).

Figure 7. Small organizations reporting expenditures between $1 and $50K by city as a percentage of total organizations and change between 2008 and 2019.
This suggests that in San José, new organizations, and those that have operated on a strictly volunteer level, find contributions and/or earn money to support their activities at a higher rate than in peer cities. They demonstrate an inclination, at least, to operate as a business and/or they successfully generated revenues in contrast to those in other cities where small organizations either choose to operate without funds, were not successful at generating revenue, or are cyclically dormant.
While not standing out among peer cities for the numbers or percentages of cultural organizations with expenditures in the $50,000 to $5 million range, San José maintained a moderate percentage of its total organizations in that category, 34%, in 2019 in comparison to Miami on the low end with 28% and Minneapolis on the high end at 42%. In this category San José ranked with San Francisco and Denver, and slightly above Seattle, cities with more robust philanthropic sectors that focus on arts nonprofits. Given a less robust philanthropic sector for the arts in San José, yet a far higher percentage of organizations in the $1 to $50k range, this points to higher entrepreneurship.
Supportive Municipal Platforms
Another dimension of both 2009 and 2020 studies is municipal investments in arts and culture in Santa Clara County, a jurisdiction representing two-thirds of Silicon Valley’s population. The 15 cities and towns in the County, including San José, played increasingly significant roles in supporting the region’s arts and cultural landscape. We found public sector spending on arts and culture among those municipalities during the past decade became more sophisticated and grew at a faster rate than inflation, population growth, and national averages. More municipalities in the County formalized their arts and cultural commissions and public art programs.
Growing investments in facilities, events, grants, and public art reflect efforts among Santa Clara County municipalities to support activities of meaning and build on a sense of place for residents. Investments such as festivals, public art, and cultural facilities, in particular, illustrate efforts by those towns and cities to include more forms of creative expression and for their cities to feel like home for residents and newcomers. Public facilities make it possible for growing numbers of small and medium-sized organizations to carry out activities with more flexibility and with less concern for overhead costs. These municipal investments represent significant elements of infrastructure that support start-ups, small and medium-sized organizations, and public activities serving diverse communities.
Conclusions
As observed in 2009, the formal arts and culture landscape of Silicon Valley exemplified a kind of Do-It-Yourself environment where many nonprofits started in response to specialized cultural interests. In retrospect, this may have been a mischaracterization. Many of these included participatory traditional and creative activities of immigrant communities as described by Moriarty (2004). Thus, their character appears to be in line with Do-It-Together organizations.[vi]
In spite of a philanthropic climate for arts and culture that is not as generous as those in many other cities and regions its size, San José and Silicon Valley maintained a higher-than-average pattern of nonprofit start-ups. It is hard to know what fuels this other than proximity to the region’s legendary entrepreneurial technology sector and growing immigrant communities who are generally well-educated and prosperous. The dearth and decline of conventional Western European cultural institutions in the region in comparison to its peers – being replaced by organizations in keeping with the region’s diverse population – appears unique among major American cities.
Among key conclusions made in our 2009 study – and born out a decade later – were that:
Most large U.S. cities and their cultural infrastructures grew up during the industrial age. They each established a handful of large, formal cultural institutions that represented stability – the preservation and reinforcement of a dominant culture and the idea of artistic excellence. Innovative arts activity and cultural diversity in those cities emerged much later as smaller, secondary activities. Silicon Valley’s ecosystem and cultural organizations represent a tectonic shift. The milieu there instead produced an adaptable do-it-yourself platform for culture, one in which diversity and informal organizational structures are central to cultural vitality rather than on the edges.[vii]
Large, formal cultural institutions represented social stability for American cities – the preservation, reinforcement, and transmission of a dominant culture. They were built around ideas of artistic excellence, honoring solitary genius (mostly male and White), centralized production, distribution to mass audiences in highly controlled environments with oversight by influential and wealthy civic and business leadership. Innovative arts activity and cultural diversity emerged on what we consider the fringes. Diverse and innovative cultural activities remained smaller, secondary activities in a continual fight for existence and recognition.
Silicon Valley’s cultural landscape represents something different. The milieu there produced an adaptable Do-It-Together platform. Yes, a symphony, ballet, contemporary art museum, and repertory theatre remain part of that landscape. However, they never gained traction to the same degree as similar institutions in peer cities and are far smaller than counterparts in those cities.
Instead, in this global, high-tech capital a cultural landscape emerged that fosters start-up of new and diverse cultural and creative enterprises as well as participant-generated self-expression by an unprecedented range of people – a “valley of many voices”. This pattern signals a more permeable cultural environment. Will other cities and regions with diversifying populations follow similar patterns?
While cities in the United States may have measured success of their cultural sectors by the age and financial wherewithal of their major arts institutions, Silicon Valley has seen the decline of its Euro-centric cultural organizations and demonstrated capacity to generate new, culturally relevant, participatory organizations. Will a new success indicator be an environment willing to let institutions built around White cultures dissolve or shrink? Will cities instead measure their cultural vitality by diverse start-ups and the relevance of organizations to ever-changing cultures and people and their creative entrepreneurial energies? Further studies over time will be needed to answer these questions and to know whether Silicon Valley is an anomaly or a harbinger of what’s to come.
NOTES
[i] Immigrant Participatory Arts: An Insight Into Community-building in Silicon Valley, 2004, Cultural Initiatives Silicon Valley.
[ii] There’s Nothing Informal About It, 2005, Cultural Initiatives Silicon Valley.
[iii] There’s No Place Like Silicon Valley: An Emerging Cultural Ecosystem for the 21st Century – A Report on the Cultural Infrastructure of California’s Silicon Valley, Creative Community Builders for 1st Act Silicon Valley, July 1, 2009, page 5.
[iv] Cultural Groups based regions defined by the World Bank: http://datatopics.worldbank.org/sdgatlas/the-world-by-region.html.
[v] 2019 data from Guidestar.org, cultural group identification done manually, 2008 data from 2008 Guidestar, cultural group identification updated manually to align with 2019 data and groups.
[vi] John Hagel III, John Seely Brown and Lang Davison, From Do It Yourself to Do It Together, Harvard Business Review, February 18, 2010.
[vi] There’s No Place Like Silicon Valley: An Emerging Cultural Ecosystem for the 21st Century – A Report on the Cultural Infrastructure of California’s Silicon Valley, Creative Community Builders for 1st Act Silicon Valley, July 1, 2009, page 6.
REFERENCES
Alvarez, Maribel. There’s Nothing Informal About It. San José: Cultural Initiatives Silicon Valley, 2005.
Borrup, Tom. “The emergence of a new cultural infrastructure: Lessons from Silicon Valley”, Journal of Urban Culture Research, 2 (2011): 16-29.
Florida, Richard. The New Urban Crisis: How Our Cities Are Increasing Inequality, Deepening Segregation, and Failing the Middle Class-and What We Can Do About It. New York: Basic Books, 2017.
Guidestar.org. “nonprofit organization profiles, arts and culture.” N.d. https://www.guidestar.org/ (accessed January 12, 2019).
Hagel, John, III, Brown, John Seely and Davidson, Lang. “From Do It Yourself to Do It Together”, Harvard Business Review, February 18, 2010.
Moriarty, Pia. Immigrant Participatory Arts: An Insight Into Community-building in Silicon Valley, San José: Cultural Initiatives Silicon Valley, 2004.
The World Bank. “the world by region.” N.d. http://datatopics.worldbank.org/sdgatlas/the-world-by-region.html (accessed, January 12, 2019).